In fact, a study by the Atlanta FED identified that U.S. investors allocated about 90% of their equity investments to U.S. markets, which only constituted c.50% of the global market capitalization at that time1. However, there are multiple benefits of investing abroad for U.S. investors. These include country and currency risk mitigation, exposure to more fragmented and specialized economies, investing at lower valuations when compared to domestic assets, having a higher ESG-positive impact, and benefitting from tax reductions. In this article, we will explore all these factors in detail and how they apply to the European private equity landscape.

Investing in Europe offers a valuable opportunity to enhance portfolio diversification by reducing the correlation of returns with the U.S. economy and currency as the European economy has a very different underlying economic paradigm, market dynamics and risks than the United States.
For example, considering central bank policy, the European central bank has proactively reduced its deposit rate to c.2.25% with further reductions anticipated, whereas the FED has kept its Federal Funds Rate steady at c.4.3%, expressing caution due to persistent inflationary pressures and economic uncertainties stemming from trade tensions. Many other European central banks also have lower deposit rates than the U.S., except for the Bank of England and the Norges Bank (the central bank of Norway), whose rate is very similar to the FED rate. This more favourable interest rate environment in Europe reduces the cost of LBO financing, increasing return expectations for funds, as they benefit from a lower cost of capital than their U.S. counterparts. Additionally, it results in the forward currency prices being more favourable when hedging forex exposure, hence enabling U.S. investors to generate an extra risk-free return, as can be seen in the graph bellow. A negative difference means that the USD is predicted to lose value against the various European currencies in the future, indicating that investing in that currency and hedging your exposure will result in extra return without taking any extra risk.

Additionally, Europe is also exposed to different geopolitical risks than the U.S. The U.S. economy is facing geopolitical tensions with its main trading partners (Canada, Mexico and China), which represent c.36% of total exports and c.43% of U.S. imports3. The EU, however, is more vulnerable to the direct effects of the conflict between Russia and Ukraine, and in response is fast-tracking energy transition and military spending, supporting sectors like renewables, infrastructure and aerospace, creating investment tailwinds in these specific industries. Investing across both regions helps diversify exposure to such risks, protecting invested assets from region-specific black swan events.
Another factor to consider is that European economies are often specialized and highly productive in specific sectors. These sectors include luxury goods in France and Italy, industrials in the DACH region, professional and financial services in the UK, pharmaceuticals in Switzerland and renewable energy in the Nordics, among others. Such economies enjoy competitive advantages in the markets they are specialised in, making investment highly attractive for investors.

Additionally, European markets are also less saturated, with much lower levels of private equity fundraising and investment when compared to GDP, population, and number of businesses than in the United States. This allows GPs to be more selective, as they have access to a comparably larger pool of companies in which to invest in and have fewer competitors investing in these assets.

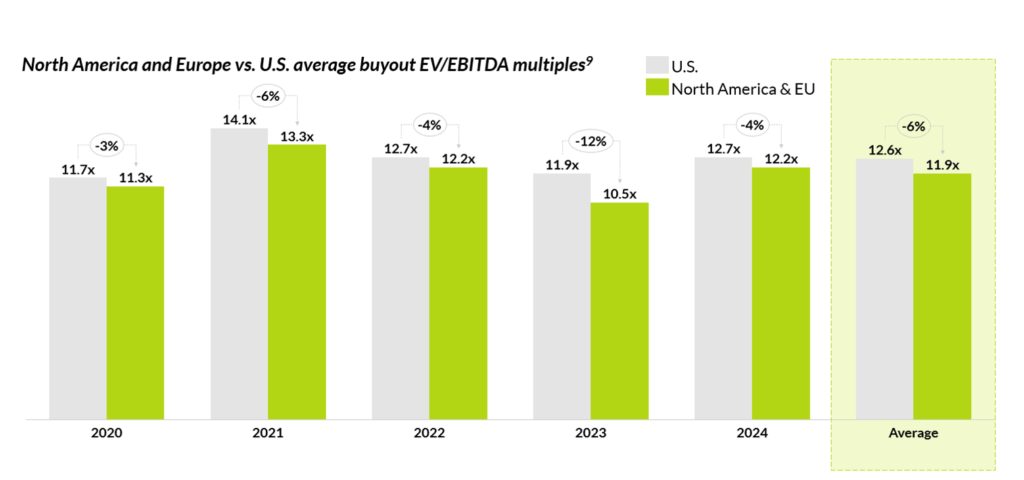
Thanks to the lower private market saturation, valuations for assets tend to be more conservative in Europe than in the U.S. On average, there is a c.6% discount between European and other North American assets (excl. U.S.) relative to U.S. assets. This valuation gap allows European managers to purchase higher quality assets at similar prices.
Additionally, there are other benefits in favour of investing in Europe. Particularly, European managers have a higher ESG orientation when investing, which helps mitigate ESG associated risks. Furthermore, European markets have policies aimed at attracting foreign investors, including tax reductions on investments. These factors further increase the attractiveness of investing in Europe for foreign investors.
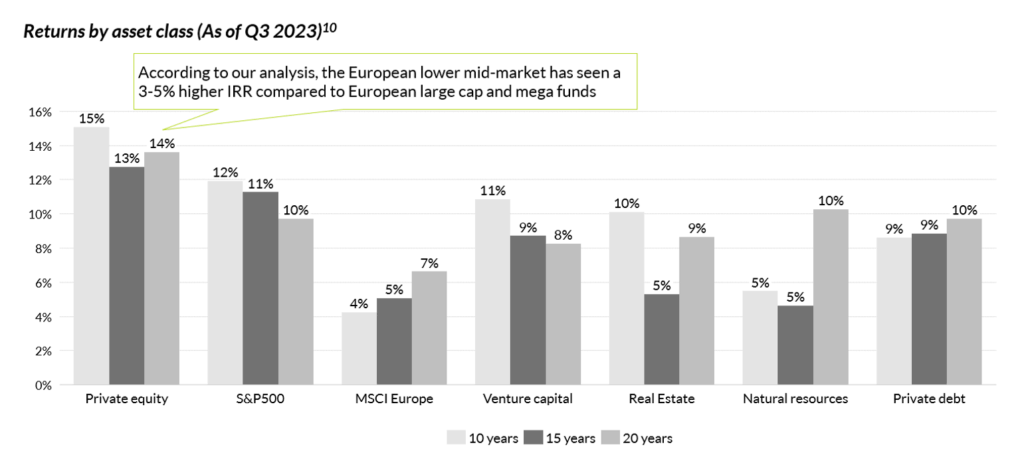
In previous articles, we have explored the superior returns investing in private equity provides to investors compared to other asset classes, and how the lower mid-market is the most attractive private equity sector for return generation.
Although there is some repeatability in performance in this space, with c.35-40% of top quartile managers also being top quartile in subsequent vintages, the degree of predictability is limited and underpinned by complex market dynamics. Additionally, top quartile funds in this space are often hard to access, oversubscribed, and only accept investors with whom they have previous partnerships in the past.

As a result, we believe that the best way for U.S. investors to invest in the European private equity market is through a fund of funds that has a longstanding presence and deep specialization in this segment, like Qualitas Funds. With this approach, you can secure access to the best managers in private equity investing in the lower mid-market, and low risk due to the high diversification component provided by the fund of funds’ structure.
Notes:
Note 1: Sourced by Standard Chartered.
Note 2: Qualitas Funds’ analysis carried out using data from FX empire as of May 6th, 2025.
Note 3: Export and import data taken from OEC. As of 2023.
Note 4: Sourced using a wide variety of sources:
- Manufacturing in Germany and U.S..
- Pharmaceuticals in Switzerland and U.S.
Note 5: Population of UK & Ireland, Nordics, DACH, France, Benelux and Southern Europe (Greece, Italy, Portugal and Spain).
Note 6: Nominal GDP as of 2024.
Note 7: Number of companies in Europe sourced from Eurostat and number of companies in the U.S. sourced from Statista.
Note 8: Sourced from Pitchbook’s Annual European PE breakdown and Annual U.S. PE breakdown report.
Note 9: Sourced from Pitchbook.