However, the extent to which it provides a strong predictor of this future performance materialising is limited, and a much wider array of factors must be taken into account.
In this article, we analyse how return persistency changes with both sector specialisation and fund strategy (e.g. buyout, growth and turnaround funds).
In the European LMM, predictability only varies slightly for different fund strategies. Our analysis shows that approximately 39% of successor funds to top quartile performers with a buyout strategy maintain their top quartile status in the next fund. Similarly, around 36% of growth funds also maintain their top quartile status. However, if we look at the percentage of top quartile funds landing in the top half, the difference increases. Approximately, 67% of funds in the top quartile land in the top half for buyout funds, compared to 54% for growth funds.
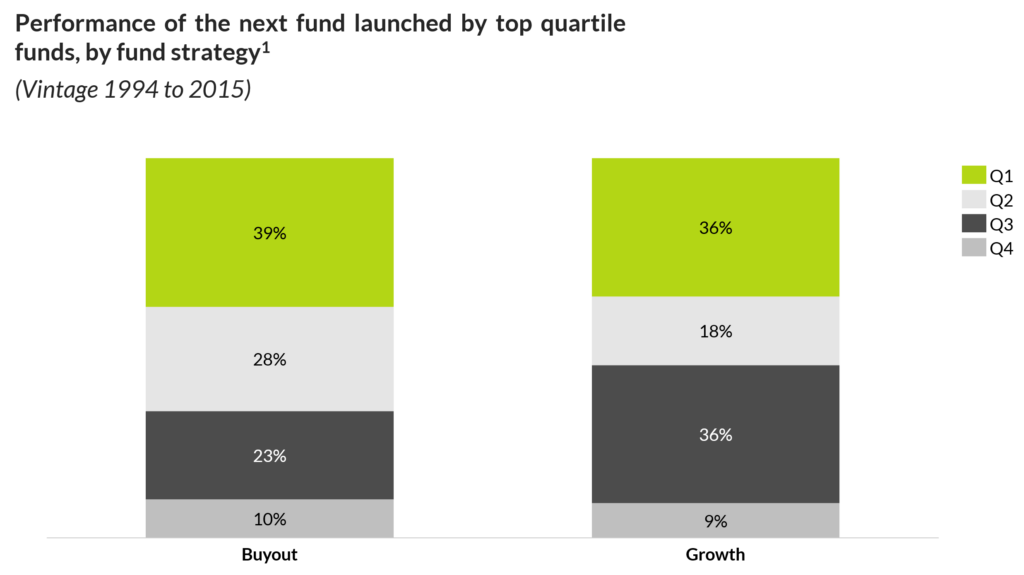
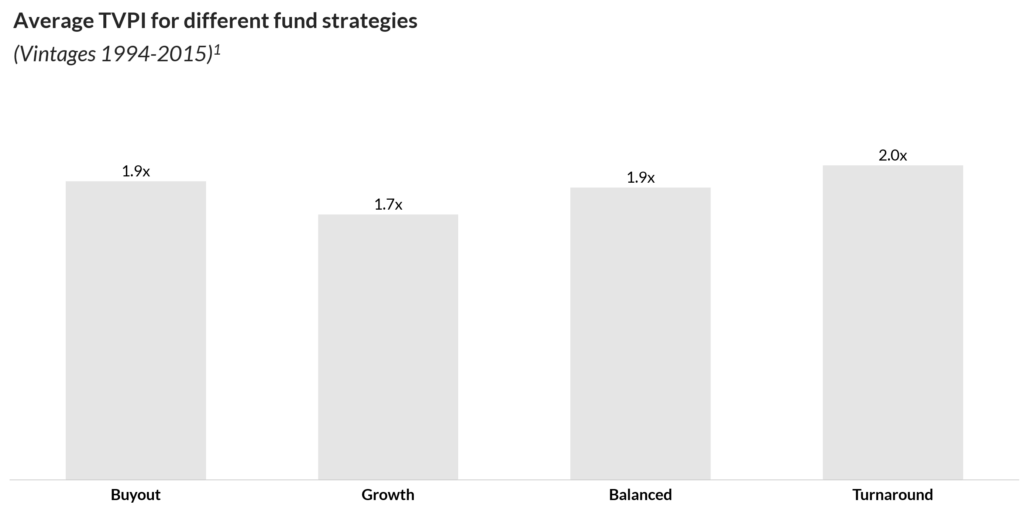
This difference may be due to the fact that overall, buyout funds in the LMM have shown a better performance than growth funds in the vintages contemplated in this analysis. On average, buyout funds have generated a net return of c.1.9x MoC, compared to c.1.7x MoC for growth funds, leading to these slight differences in repeatability.
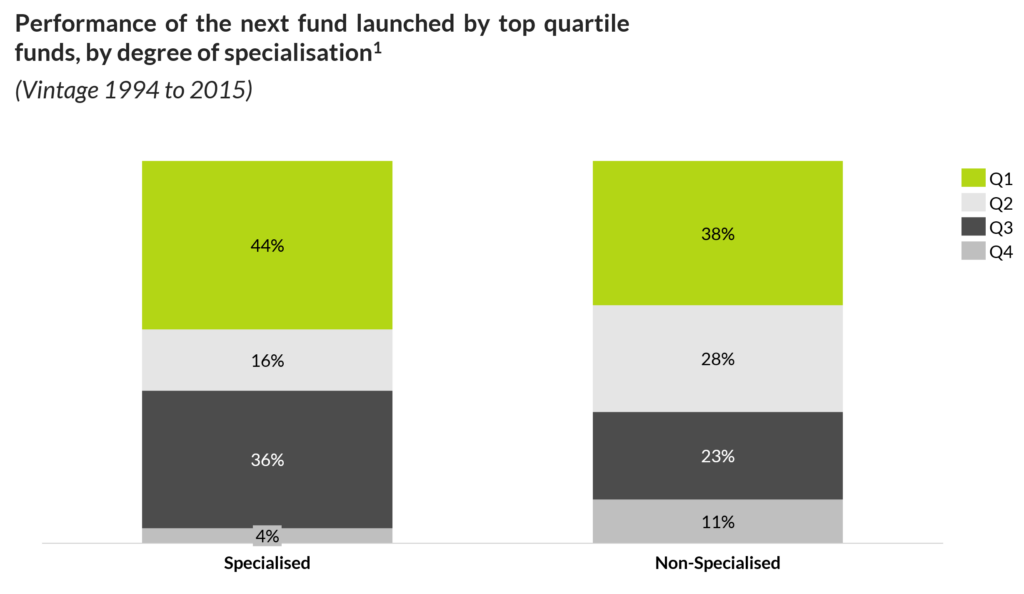
A slight difference in predictability also emerges when considering the degree of specialisation of funds. Around 44% of successor funds to top quartile specialised funds maintain their top quartile status. In contrast, only 38% of successor funds to non-specialised funds in the top quartile maintain their status.
This slight change in predictability can be attributed to the superior returns seen from specialist funds in comparison to generic funds. External third-party analysis2 has revealed that sector-focused GPs tend to obtain better results when considering transactions within their sector. Their superior sector know-how and experience, the complementarity of companies in their portfolio, and their extensive network within the sector allow them to support their portfolio companies more effectively, thereby driving value creation. This, in turn, translates into higher returns at exit.
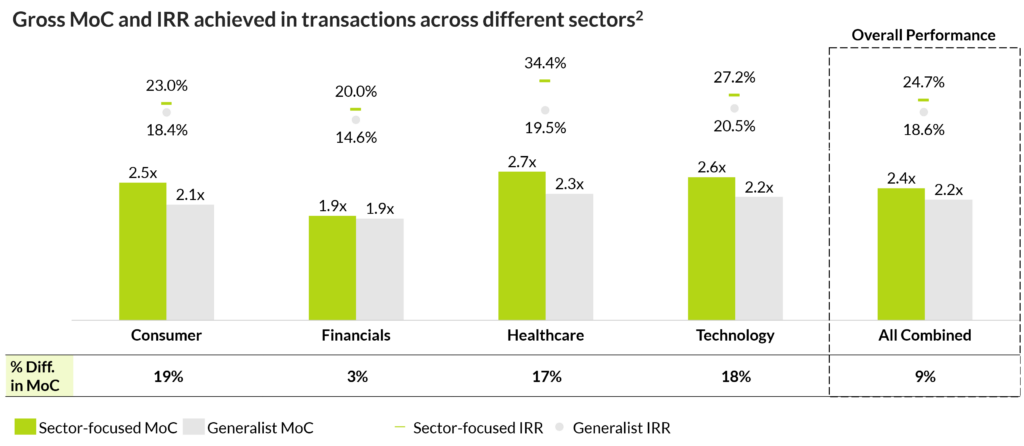
Overall, sector-focused funds generate c.2.4x gross MoC on average for their realised portfolio companies, compared to c.2.2x gross MoC for generalist funds. This implies a c.9% difference in returns between specialised and non-specialised funds on average, resulting in those slight differences in repeatability.
Hence, we can conclude that past private equity performance can serve as an initial indicator of future fund returns, but the extent to which it can provide a guarantee of future performance depends on the characteristics of both the fund in question and its successor fund. Funds which show moderate degrees of fund size increase, are specialised, or have a buy-and-build strategy, tend to have more predictable returns in comparison with funds of other characteristics.
It is important to note that the probability of a successor fund to a top quartile performer landing in the top quartile is inferior to 50% even for funds where these three characteristics are met. Hence, deep due diligence needs to be conducted before investing, covering all aspects of a fund’s strategy, team, portfolio, track record and investment terms, to gain sufficient conviction on the opportunity ahead of investing.
Notes
Note 1: Sourced from Preqin and complemented with data from Qualitas Insight. Filtered to include private equity funds which have a geographical focus in Europe, fund sizes of less than €1BN and vintages before 2015. Quartiles are based on MoC and have been calculated using the analysis dataset.
Note 2: Third-party analysis from Cambridge Associates. Sourced from Cambridge Associates LLC Private Investments Database. Data represents realized and unrealized investments within the Cambridge Associates US Buyout and Growth Equity Benchmark initiated between 2001 and 2015. MoCs and IRRs are based on the aggregated performance of investments categorized as sector or generalist. All performance is gross of fees and expenses.