While public markets have recently outperformed, historical trends suggest that private equity tends to deliver stronger long-term performance. This article explores why private equity often offers a superior return profile and how its historical outperformance continues to shape investment strategies today.
Over the past year, public equities have experienced remarkable growth, achieving unprecedented rates of expansion. The S&P 500 has reached a new all-time high on 57 occasions in 2024 alone, accounting for over 20% of the trading days so far this year. Unsurprisingly, this surge in record highs has led public equity markets to outperform private equity benchmarks in recent months.
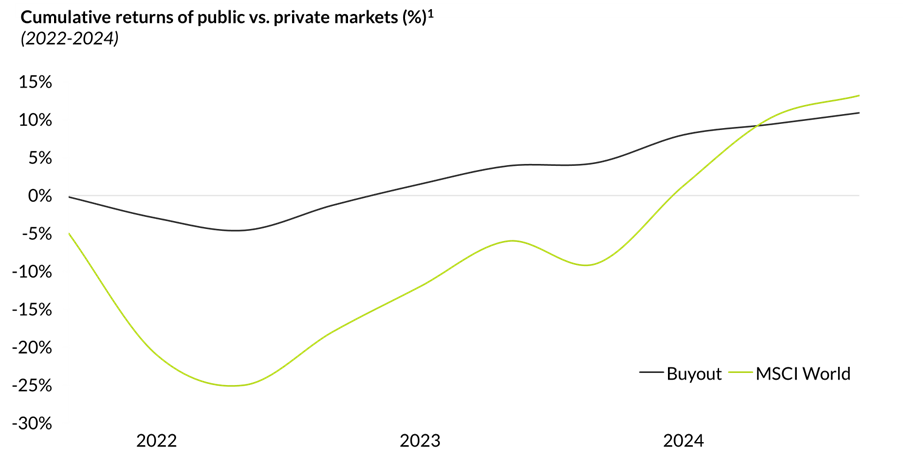
Despite heightened volatility, public market indices have demonstrated exceptional performance over the past year. Even more, over a three-year period, the MSCI World Index has delivered a cumulative return of 13.2%, surpassing private equity buyout funds by 2.2 ppts. The robust performance of public markets has reignited debate over whether private markets continue to offer a superior long-term investment proposition.
To effectively address this question, it is essential to examine several key factors. One significant driver of growth in the public equity market has been a small, concentrated group of companies within the public indices, often referred to as the “Magnificent 7”.
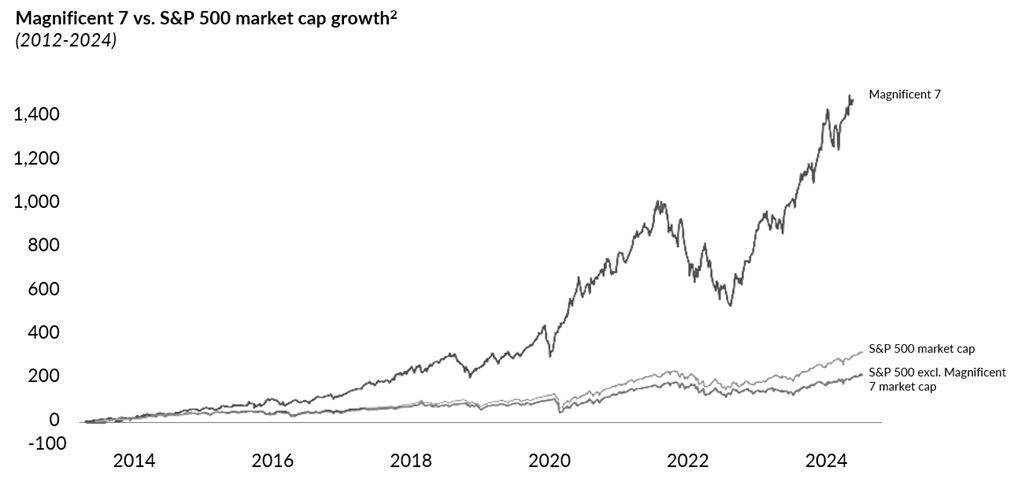
These seven companies now represent 30% of the total S&P 500, indicating a significant level of concentration. They have been the primary contributors to the index’s return performance, while the remaining 493 companies have delivered more modest results. In 2024, the Magnificent 7 are projected to achieve fundamental earnings growth exceeding 30% compared to the previous year, whereas earnings for the other 493 companies in the S&P 500 are expected to grow by a modest 3%. Unsurprisingly, this disparity has fuelled a notable P/E (price-to-earnings) premium for the Magnificent 7.
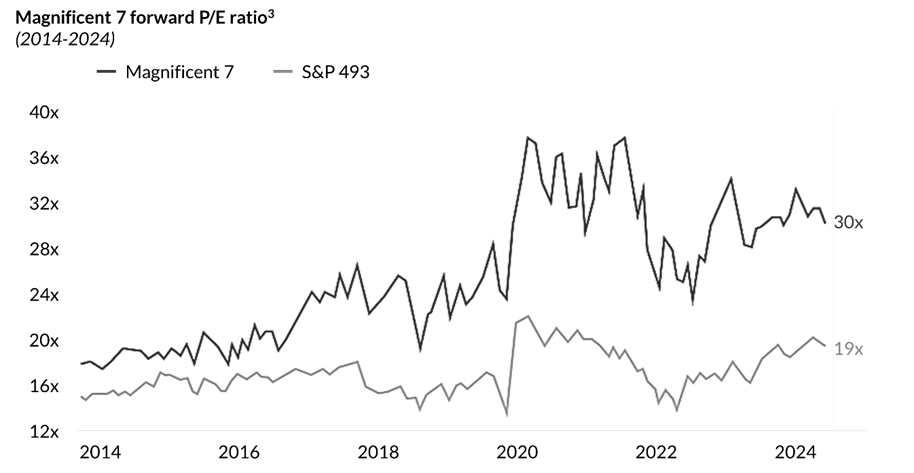
The reality is that this small, concentrated group of companies in the public index has been trading at extremely high price-to-earnings (P/E) multiples. Their average forward P/E ratio exceeds the S&P 493 average by c.60%, highlighting the disparity between these seven companies and the rest of the market, and raising concerns about the sustainability of such growth in the long term. Additionally, major institutions are wary of the performance of the S&P 500 in the near future and expect to have a slowdown over the coming year. Morgan Stanley, Goldman Sachs and JPMorgan forecast the S&P 500 to rise c.7% over 2025, which is c. 4ppts below the index’s historical average return of c.11%⁴.
While public equity returns have recently experienced a significant boom, it is essential to evaluate how returns in both private and public markets have performed over a longer time horizon.
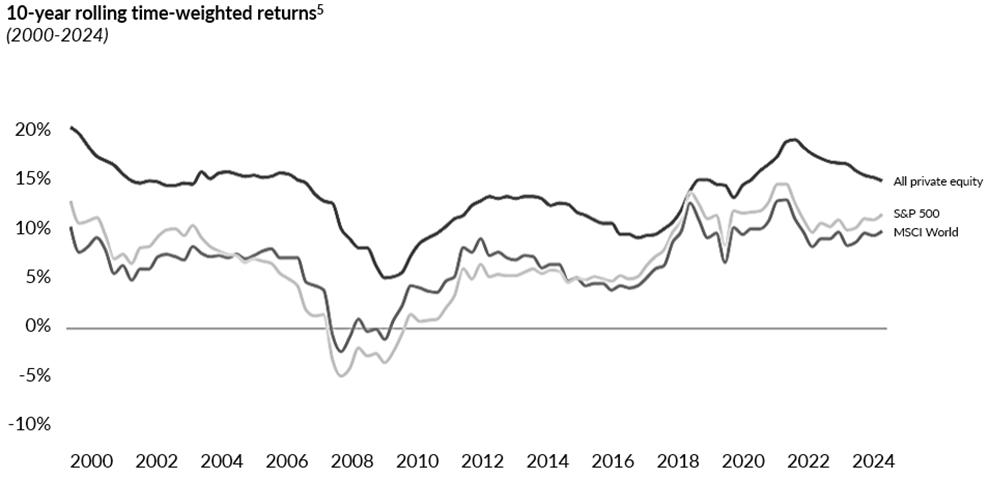
Historically, private equity benchmarks have consistently outperformed public market returns while maintaining lower volatility, even during significant economic disruptions such as the Dotcom Bubble and the Global Financial Crisis. Over the past +20 years, data shows that the longer-term trailing performance of public markets has rarely exceeded the net average returns of private equity. This historical trend highlights the resilience of private markets, which have delivered superior returns with less volatility, even in periods of market stress, contrasting with the recent surge in public market performance.
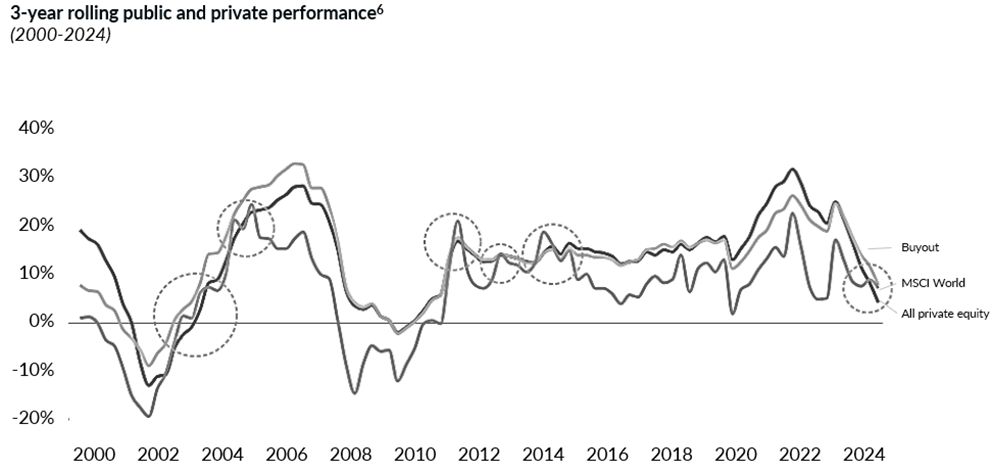
Since 2000, public markets have outperformed private equity in three-year trailing performance intervals on five occasions. However, such instances of public market outperformance have typically been short-lived, with private equity returns often regaining the lead in the following year. On average, the subsequent three-to-five-year periods after these intervals have seen private equity outperform public markets by an average of 850 to 1,050 basis points in go-forward results⁷.
Having established the historical outperformance of private equity over public markets, it is equally important to identify which segment of the private equity market is driving these superior returns.
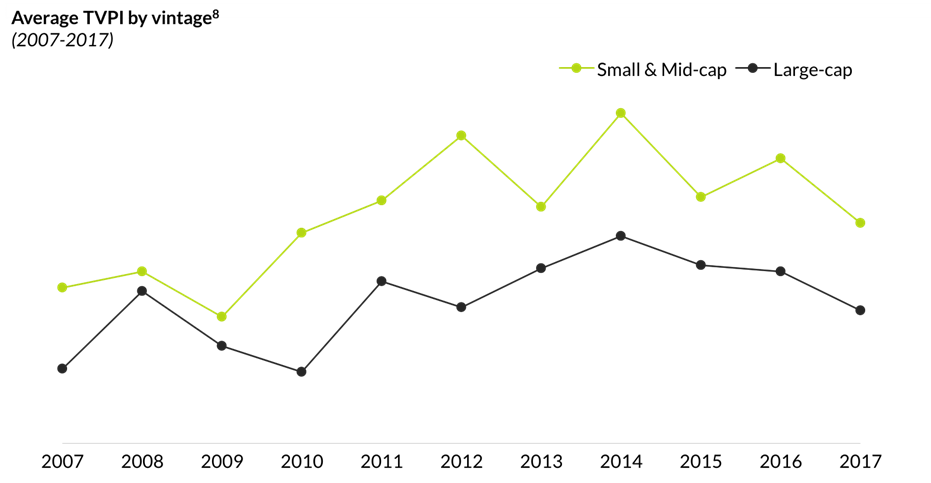
Small- and mid-cap funds have consistently outperformed large-cap funds in terms of TVPI. Data from vintages spanning 2007 to 2017 shows that small- and mid-cap funds delivered a TVPI that is, on average, 15% higher than that of large-cap funds. This performance advantage stems from distinct dynamics in the lower segments of the market.
A significant factor is the lower level of competition. In 2024, lower mid-market funds accounted for just 14% of the capital raised in the private equity market, allowing them to target a wide range of opportunities. SMEs, which represent 93% of companies globally , provide these funds with a broad pool of targets and more attractive entry points, as there are fewer bidders for these deals.
In contrast, large-cap funds face intense competition for a limited number of high-profile transactions. These funds must allocate 86% of the capital raised in 2024 across just 7% of companies worldwide. This concentration drives up entry valuations and compresses future returns. Historically, small- and mid-cap companies have been acquired at a 20-25% discount compared to large-cap companies.
Furthermore, the lower market segments offer distinct advantages, such as niche fragmented markets, smaller-scale deals, and often more concentrated portfolios. These factors enable value-accretive strategies like buy-and-build or systematic M&A to thrive. Over the past 25 years, small- and mid-cap funds have been significantly more active in M&A, completing more than twice as many add-on acquisitions on average compared to large-cap funds.
This combination of reduced competition, attractive entry valuations, and active M&A strategies underpins the consistent outperformance of small- and mid-cap funds relative to their large-cap peers.
Despite the recent outperformance of public markets, private equity remains an appealing opportunity for investors seeking superior long-term returns. Within private equity strategies, the lower middle market segment stands out as the most attractive. It provides GPs with a favourable environment characterised by less competition, more attractive entry points, and increased opportunities to pursue value-accretive strategies, thus increasing overall returns.
Notes
Note 1: Source: Hamilton Lane Data via Cobalt, Bloomberg (October 2024).
Note 2: Source: LSEG Datastream and Yardeni Research. Magnificent-7 stocks include Alphabet (Google), Amazon, Apple, Meta (Facebook), Microsoft, NVIDIA, and Tesla. Both classes of Alphabet are included. Indexed to 0 on 12/28/2012.
Note 3: Source: Goldman Sachs Global Investment Research.
Note 4: Source: Financial Times. https://www.ft.com/content/8cc8fa3f-ce2c-463a-90a0-6cc4bb02c091.
Note 5: Source: Hamilton Lane Data via Cobalt, Bloomberg (October 2024).
Note 6: Source: Hamilton Lane Data via Cobalt, Bloomberg (November 2024).
Note 7: Source: Hamilton Lane. https://www.hamiltonlane.com/en-us/insight/inflection-point.
Note 8: Source: Pitchbook, Syz Capital.